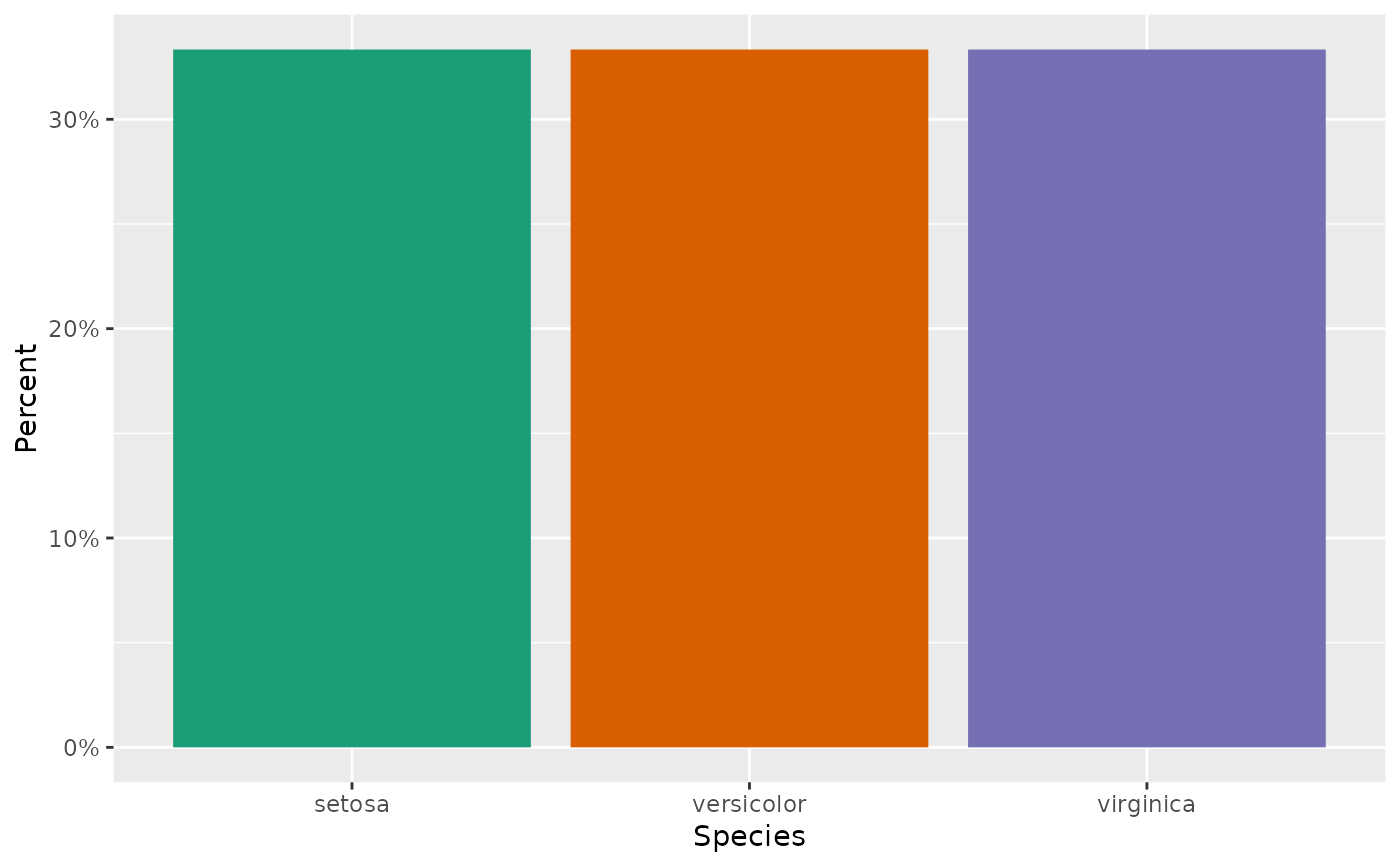
This function simply wraps around ggplot2::geom_col() to take a dataframe
and categorical variable to return a custom barplot ggplot object. The bars
are arranged in descending order and are limited to the 8 most frequent
values.
explore_plot(data, var, nbar = 8, palette = "Dark2", na.rm = TRUE)Arguments
- data
The data frame to explore.
- var
A variable to plot.
- nbar
The number of bars to plot. Always shows most common values.
- palette
The color palette passed to [ggplot2::scale_fill_brewer().
- na.rm
logical: Should
NAvalues ofvarbe removed?
Value
A ggplot barplot object. Can then be combined with other ggplot
layers with + to customize.
Examples
explore_plot(iris, Species)
